Diagrams That Deceive: A Student's Guide to Spotting Scientifically Outdated Illustrations in School Textbooks
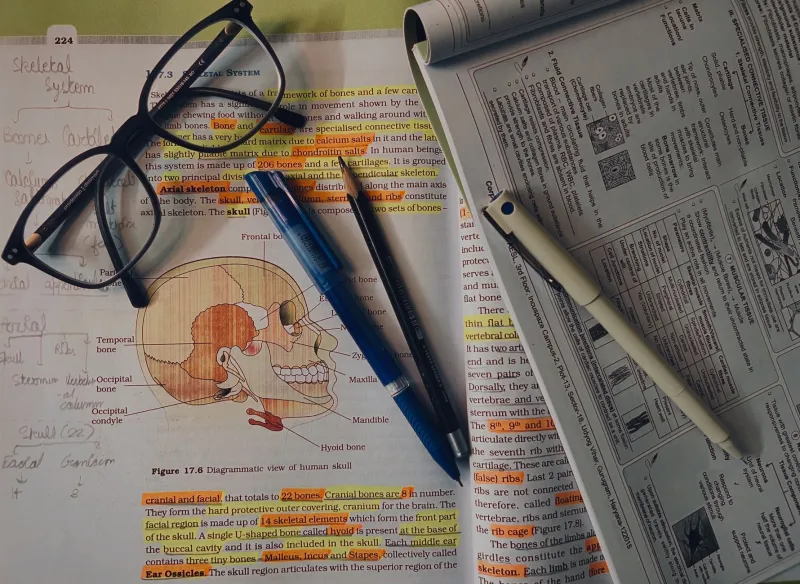
A textbook does not need to contain false statements to mislead a student. Sometimes, a single diagram does the job quietly and efficiently. Illustrations are among the most powerful teaching tools in any science course, yet they are also among the most likely components of a textbook to fall behind current scientific understanding. Because images are expensive to commission, license, and update, publishers frequently recycle visual assets across editions, sometimes for fifteen years or more.
For students trying to build an accurate understanding of the natural world, and for parents trying to support that process, knowing how to interrogate a textbook's visuals is an essential skill. This resource from MyiLibrary Science walks through the most common problem areas, explains what accurate illustrations should convey, and offers strategies for locating updated materials.
Why Textbook Illustrations Lag Behind the Science
The production cycle of a major educational textbook in the United States typically spans three to five years from manuscript to classroom. By the time a book is adopted by a school district, revised by a state curriculum committee, and distributed to students, the underlying science may have moved considerably. Illustrations, which require additional design and production time beyond text revisions, are often the last elements updated—and the first to be carried over unchanged when budgets are tight.
This creates a structural problem: a student may be reading prose that has been carefully revised while simultaneously studying a diagram that originated in an earlier edition. The two can contradict each other in subtle ways that are difficult for a non-specialist to detect.
Cell Structure: Where the Visuals Fall Furthest Behind
Few areas of science education show this problem more clearly than cell biology. Many textbooks still present the cell membrane as a rigid, symmetrical bilayer with proteins embedded at fixed points—a model that reflects the early fluid mosaic framework from the 1970s. Contemporary cell biology recognizes the membrane as a highly dynamic, asymmetric environment in which lipid composition, protein clustering, and mechanical tension all vary in real time.
Similarly, diagrams of the nucleus frequently present it as a smooth sphere containing loosely coiled chromosomes. Current research, including findings from cryo-electron microscopy studies, reveals a far more architecturally complex structure, with the nuclear lamina, chromatin territories, and nuclear pore complexes forming an organized three-dimensional landscape.
What to look for: If a cell diagram uses flat, uniform shading and presents organelles as static, symmetrically arranged objects, it may be based on models that predate modern imaging techniques. Compare what you see in your textbook against resources such as the National Center for Biotechnology Information's (NCBI) educational image library or the Howard Hughes Medical Institute's BioInteractive platform, both of which maintain current, peer-reviewed visual content.
Planetary Science and the Solar System: Still Teaching Pluto as a Planet?
The reclassification of Pluto as a dwarf planet occurred in 2006, yet solar system diagrams that include Pluto as the ninth planet continue to appear in textbooks still in circulation in some districts. This is one of the more easily verified examples of outdated illustration, but it points toward a broader pattern.
Planetary scale is another persistent problem. Diagrams that show the eight planets at relative sizes proportional to their actual diameters almost never show accurate inter-planetary distances, because doing so at the same scale would make most of the image empty space. This is a known pedagogical compromise, but textbooks that fail to note this limitation leave students with a fundamentally distorted sense of the solar system's geometry.
What to look for: Check whether your textbook's solar system diagram includes a note about scale. If it does not, treat the proportions as illustrative rather than accurate. NASA's Eyes on the Solar System, a free interactive platform, provides scale-accurate visualizations that are useful for comparison.
Disease Mechanisms: Simplified to the Point of Inaccuracy
Immunology and infectious disease are areas where simplification in textbook illustration frequently crosses into misrepresentation. The classic diagram of an antibody binding to a single antigen on a pathogen surface, while useful as a conceptual introduction, omits the polyclonal nature of immune responses, the role of innate immunity, and the signaling complexity that determines whether an immune response is mounted at all.
During and after the COVID-19 pandemic, many American students encountered textbook immunology chapters that had no framework for understanding concepts such as viral variants, mucosal immunity, or mRNA-based vaccine mechanisms. The illustrations in those chapters were not merely simplified—they were insufficiently equipped to support the questions students were actually asking.
What to look for: If a disease mechanism diagram shows a single, linear pathway with no feedback loops or conditional branches, it is almost certainly a simplified model. That is not inherently wrong, but the diagram should be labeled as such. Cross-reference with resources such as the Immunology section of Khan Academy's MCAT preparation materials or the public-facing content from the American Society for Microbiology.
A Practical Evaluation Checklist for Students and Parents
When reviewing a textbook's scientific illustrations, consider the following questions:
- Is a publication or revision date visible? If the textbook was last revised more than eight years ago, its illustrations warrant particular scrutiny in fast-moving fields such as molecular biology, neuroscience, and climate science.
- Does the diagram include a scale indicator? Diagrams without scale references can distort spatial understanding, particularly in astronomy and cellular biology.
- Is the visual labeled as a model or a simplified representation? Accurate educational materials distinguish between models and depictions of observed reality.
- Does the diagram align with what current databases show? Platforms such as PubMed Central, NCBI's bookshelf, and university open courseware often include updated figures from recent textbooks or review articles.
Where to Find Updated Visual Resources
Several platforms provide current, peer-reviewed scientific illustrations at no cost:
- HHMI BioInteractive (biointeractive.org): Offers animations and visual resources aligned with current research in biology.
- NASA Image and Video Library (images.nasa.gov): Provides accurate, up-to-date imagery for earth and planetary science topics.
- Visible Body (visiblebody.com): Offers detailed anatomical models; a free version is available for basic exploration.
- OpenStax (openstax.org): Provides peer-reviewed, openly licensed textbooks with more recently updated illustrations than many commercial alternatives.
The Broader Lesson
Learning to evaluate a diagram is not merely a study skill—it is a form of scientific literacy. Students who develop the habit of asking whether a visual reflects current knowledge are cultivating the same critical instinct that researchers apply when reviewing published work. MyiLibrary Science encourages learners at every level to treat their textbooks as starting points rather than final authorities, and to build the habit of verification early. The diagram on page forty-three may be correct, or it may be a relic. Knowing the difference is part of what it means to think like a scientist.